

A body-fat estimate reads 24% at one assessment and 22% at the next. The numbers are easy to compare; deciding what that two-percentage-point difference actually means is the harder part.
Body-composition measurements have their own variability. When two results are compared over time, the observed difference needs to be considered alongside the precision of the measurement procedure rather than interpreted from the numerical change alone. A shift in the reported value can reflect biological change, measurement variability, or some combination of the two.1,2
Precision and validity answer different questions. Precision, or repeatability, describes how closely a method reproduces a result when measurements are repeated under similar conditions. Validity or agreement with a reference method concerns whether those measurements correspond closely to another accepted approach. A device can therefore give very similar readings from one test to the next without necessarily agreeing closely with another method.1,3
Consistency becomes especially important when the goal is to track change. Using the same method, equipment, software, and testing procedure makes repeated measurements more interpretable. Conditions such as time of day, food and hydration status, and recent exercise can also affect some body-composition assessments, so changing the testing setup can introduce differences that have little to do with a true change in body fat.1
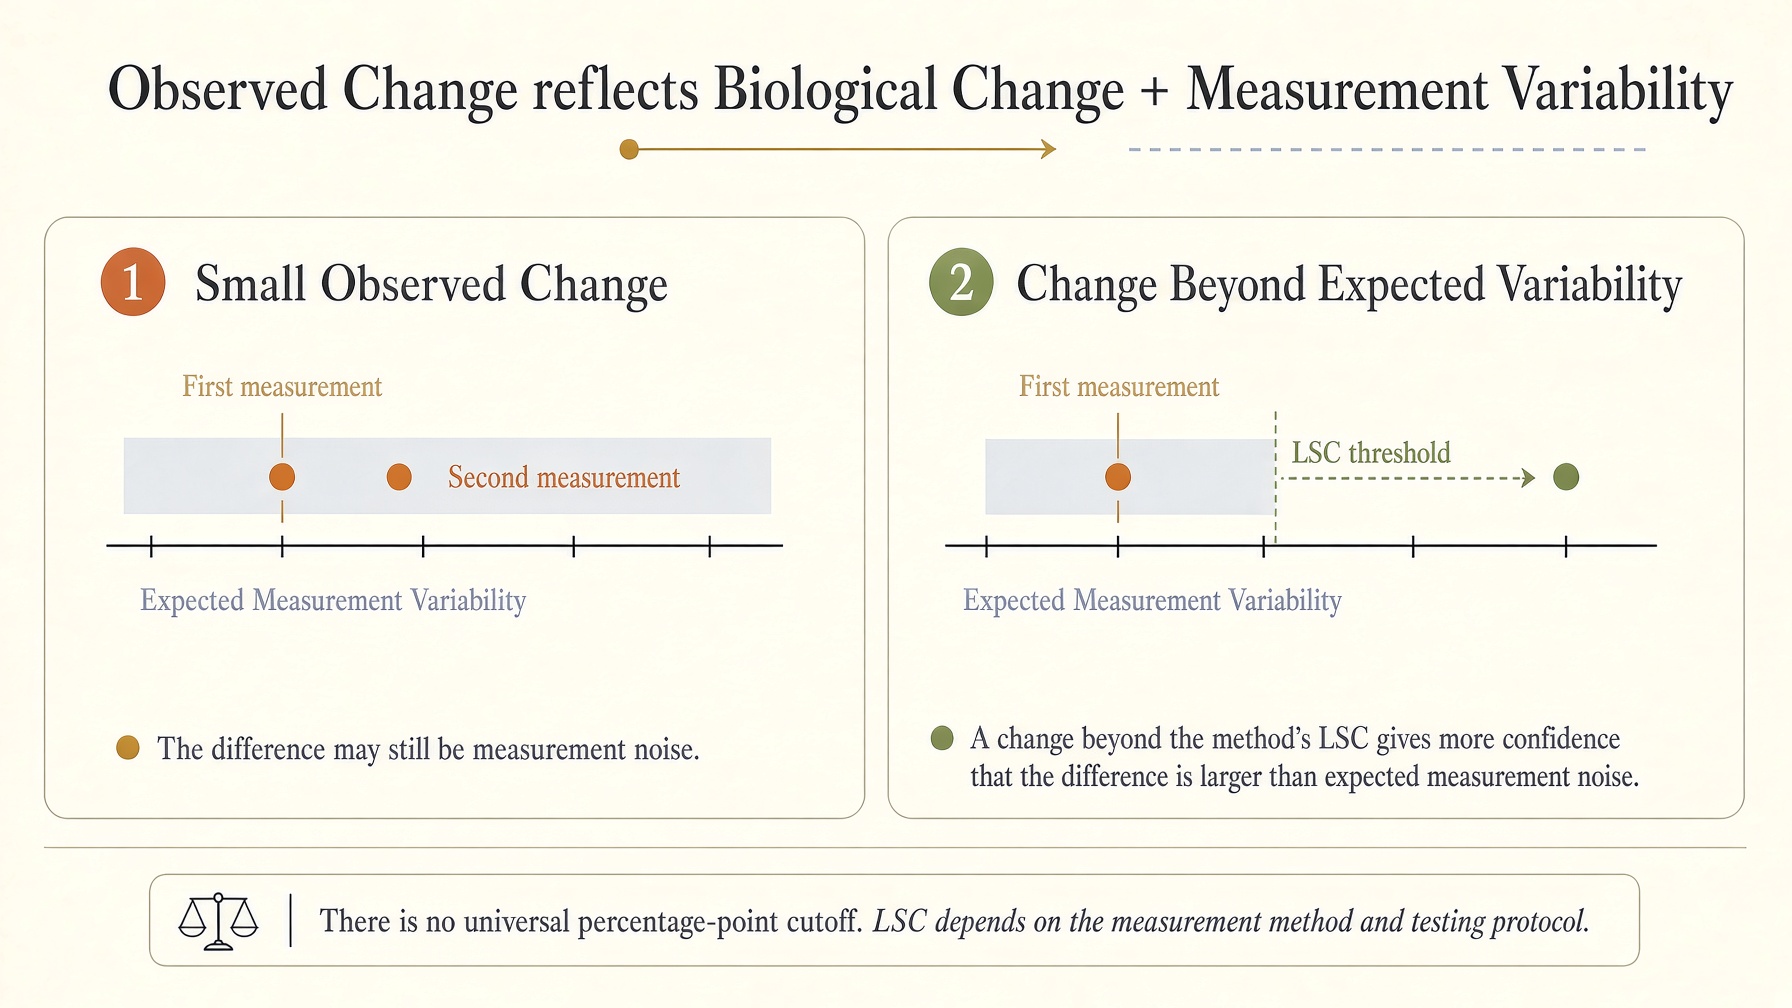
Precision error and least significant change, or LSC, provide ways to judge whether a difference is larger than the variability expected from repeated measurements. These values depend on the device, procedure, population, and how precision was established; they are not universal percentage-point cutoffs. Exceeding an LSC can increase confidence that a difference is larger than expected measurement noise, but it does not by itself explain what produced the change.1,2,3
Even the timing of repeat measurements can affect precision estimates. In a study of 32 resistance-trained men, several body-composition methods showed greater variability between measurements taken on consecutive days than between repeated measurements taken on the same day. The finding was specific to this population and short interval, but it demonstrates that immediate repeatability can underestimate the variability seen when measurements are repeated later.2
Different technologies should not be assumed to produce interchangeable body-fat estimates either. A 2026 study of 44 healthy women aged 40–65 compared DXA, bioelectrical impedance analysis, and 3D optical scanning. Most whole-body measurements showed acceptable repeatability, although 3D scanning did not meet the study's preset precision criterion for body-fat percentage. Agreement between methods was also limited at the individual level, so changing devices during follow-up can make a trend harder to interpret.3
There is therefore no single change—one percentage point, two percentage points, or another fixed number—that has the same meaning for every body-composition method. The size of the difference matters, but so do the precision of the method and the consistency of the conditions under which the measurements were made.1,2,3
A move from 24% to 22% may be worth noticing without treating either number as self-explanatory. A trend becomes easier to read when the way it is measured stays as steady as possible.
Join the discussion
No account or email is required. Your display name and comment will be public.