

At the fruit counter, “lower sugar” can sound like a clear way to choose. Then one list ranks berries by sugar, another compares carbohydrates, and a third changes the order again. If you have ever wondered why an ordinary bowl of fruit suddenly needs so much interpretation, the first step is to ask what each number actually measures.
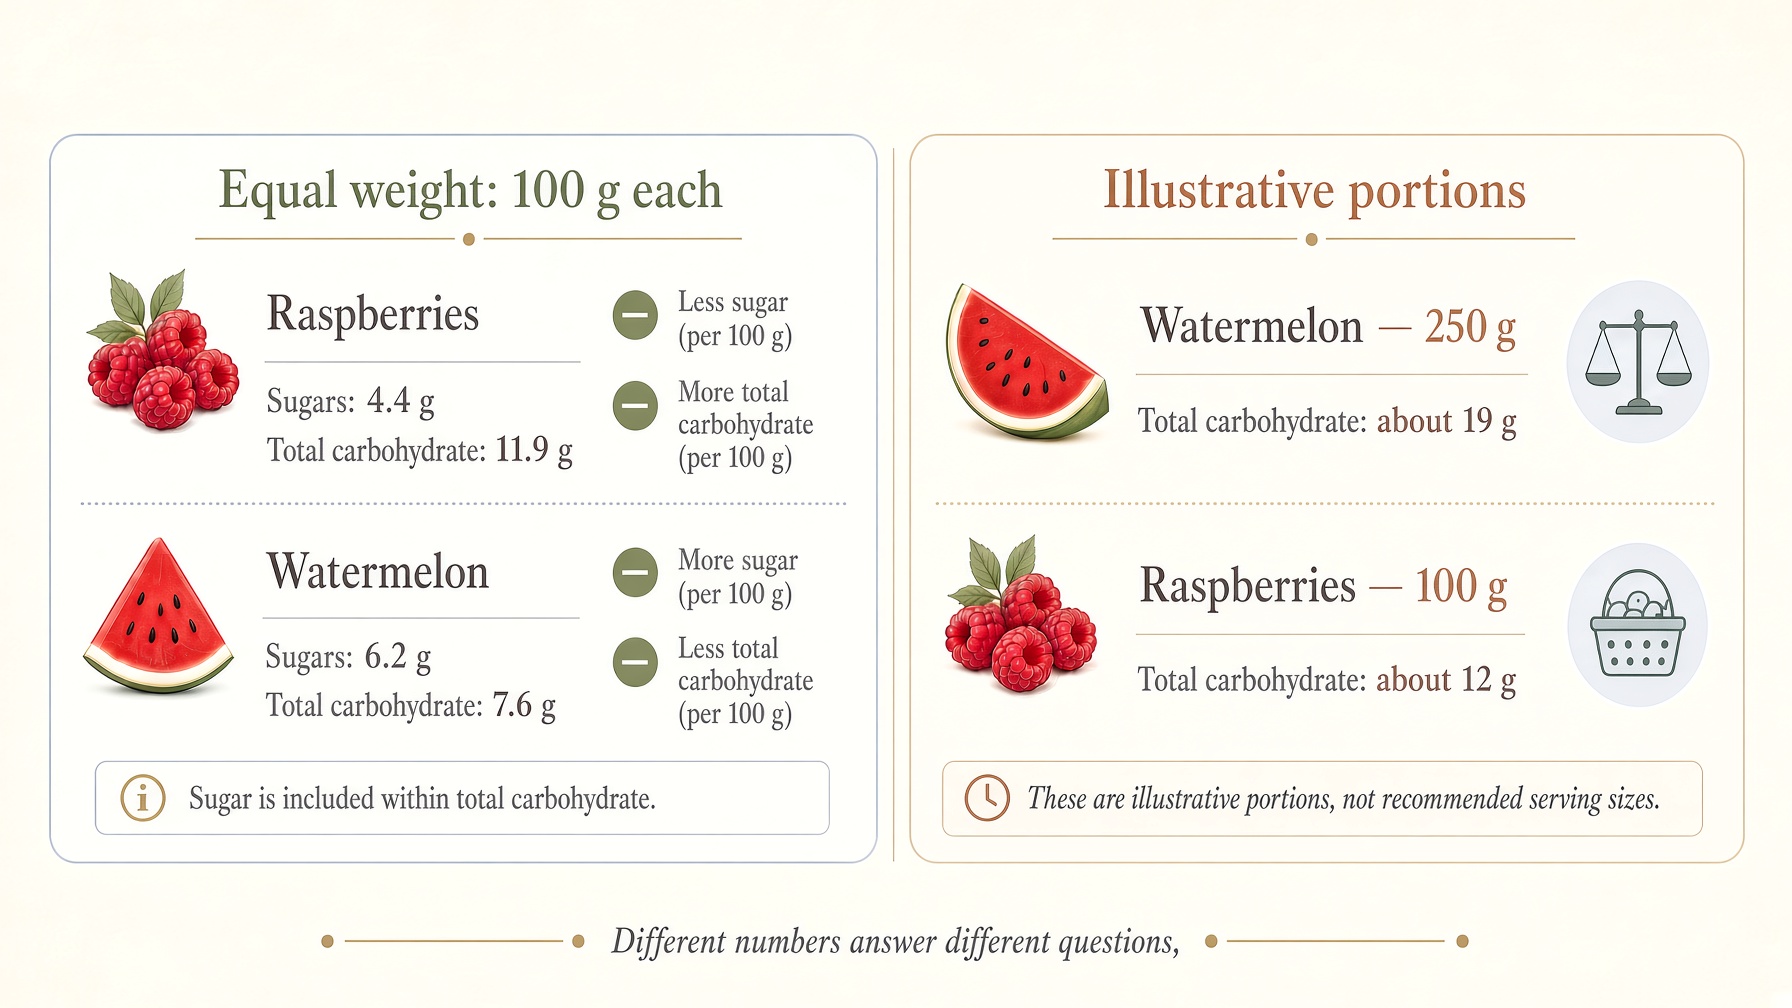
Sugar and total carbohydrate are not the same entry in a food-composition table. USDA data include sugars as part of total carbohydrate, alongside other components such as fiber. Raw raspberries contain approximately 4.4 grams of sugar and 11.9 grams of total carbohydrate per 100 grams. Watermelon contains approximately 6.2 grams of sugar but 7.6 grams of total carbohydrate. One has less sugar while the other has less total carbohydrate by weight. 1
The word “sugar” also appears in different categories. Total sugars describe the sugars present in a food. The World Health Organization's definition of free sugars includes those added to foods and drinks, as well as sugars naturally present in honey, syrups and fruit juice. Sugars within intact fruit are outside that free-sugar category. A total-sugar value for whole fruit is therefore not interchangeable with the free-sugar intake addressed by that guideline. 2
The denominator is just as useful as the nutrient name. “Per 100 grams” allows a comparison at equal weight, but it does not tell you how much fruit is in your bowl. Using the rounded USDA values above, a 250-gram portion of watermelon contains about 19 grams of total carbohydrate, while a 100-gram portion of raspberries contains about 12 grams. These are illustrative portions, not suggested serving sizes. Changing the amount changes the comparison. 1
Even that calculation is not a personal prediction of blood glucose. Glycemic index describes the relative glucose response to a standardized amount of available carbohydrate, whereas glycemic load also takes account of the available carbohydrate in a portion. “Available” carbohydrate is not identical to the total-carbohydrate figure that includes fiber. Sugar grams, total carbohydrate and glycemic measures answer related but different questions. 3
A nutrient ranking is not a complete ranking of health effects either. A systematic review of prospective studies found that higher total fruit intake was associated with a modestly lower incidence of type 2 diabetes. Because the evidence was observational, it could not establish that fruit caused the difference. It nevertheless offers a different kind of information from a list that sorts foods only by their sugar content. 4
The next time you compare two fruits, you can decide what you actually wanted to know before following the ranking. Perhaps you are checking a portion, reading a label or simply choosing something you enjoy. The numbers can remain useful without turning the choice into a contest for the “best” fruit.

Join the discussion
No account or email is required. Your display name and comment will be public.